How Laptop Mag tests laptops
For well over a decade, Laptop Mag has been testing notebooks in our lab to help you decide which ones rise above the rest
Laptops these days are as diverse as the people who use them. They come in all different shapes, sizes, and colors, and can be built from hardware designed to optimize your work, supercharge your play, or just make your everyday life a little easier. If you’re one of the millions of people who are shopping for a laptop, it can be hard to sift through the specs, speeds and feeds, and specious performance claims from the manufacturers. That’s what we’re here for.
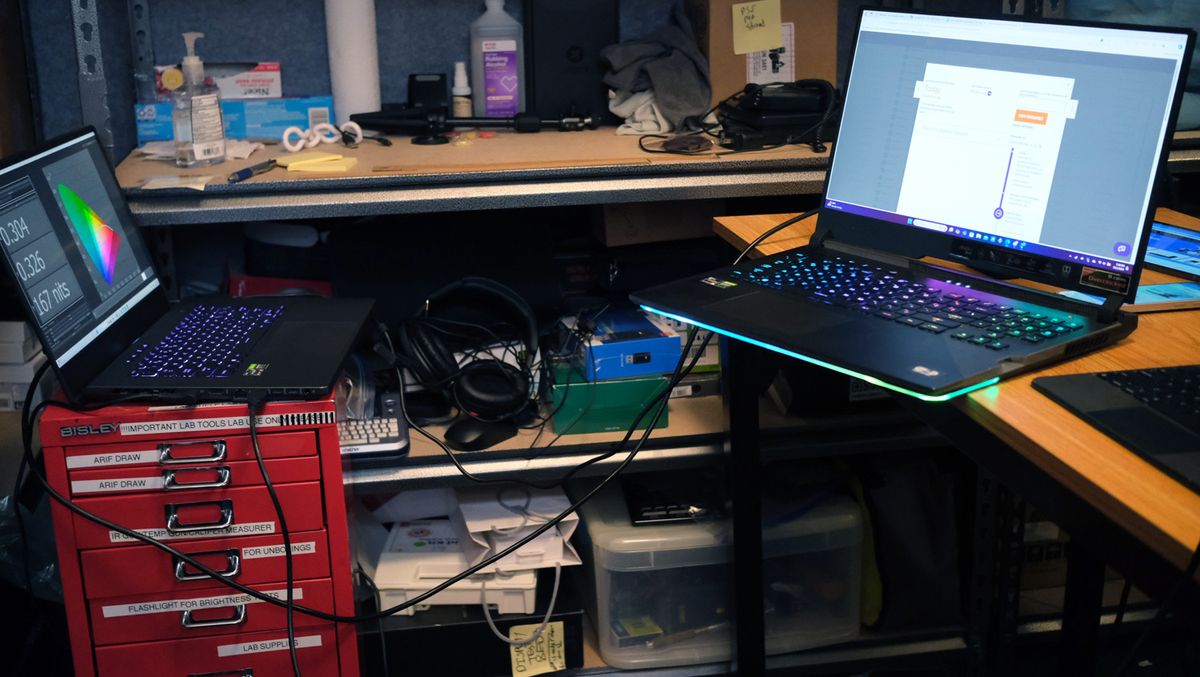
Laptop Mag reviews more than a hundred different models every year, from paperweight ultralights to everyday workhorses to lumbering gaming notebooks that scorch the frame rates of even the hottest AAA games. The writers and editors scour the available information about the laptop and put it through its paces to determine which is best for you. But before they start, the testing team subjects each system to a rigorous regimen of synthetic and real-world tests to see how a system handles the type of work and games you’re most likely to throw at it.
Here’s an in-depth look at what we evaluate about each and every system you see reviewed on Laptop Mag.
What we test on all Windows laptops
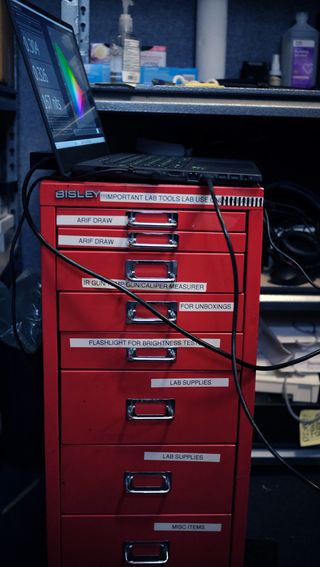
Productivity Tests
BAPCo Crossmark: For more than 30 years, the Business Applications Performance Corporation (aka BAPCo) has worked with leading technology companies to develop rigorous and reliable benchmark tests. One of BAPCo’s newest creations is Crossmark, which runs an in-depth collection of workloads designed to gauge system responsiveness and prowess on productivity (document editing, spreadsheets, Web browsing) and creativity (photo editing and organization, and video editing) tasks; the four scores it generates (one for each category, plus an overall result) can be used to compare performance not just between Windows PCs, but also any devices that run Android, iOS, or macOS.
Geekbench: There’s a reason that Geekbench is a ubiquitous title on the system benchmarking scene: It distills a number of complex computing tasks into simple results that give an immediate impression of performance on PCs, Macs, Chromebooks, and even smartphones and tablets. We only use the CPU Benchmark, which examines how the processor handles activities like text and image compression; HTML5, PDF, and text rendering; HDR and ray tracing; machine learning; and more. Geekbench crunches these numbers into single- and multicore results; we typically only report the latter, as it’s most relevant today, but the former can inform our evaluation as well. The most current version of Geekbench is 5.4
File Copy: We’ve all been there: We’re cleaning up one of our storage drives and we move a folder that has more files in it than we expected—and it takes a long time. Because it’s nice to know how a laptop might handle this eventuality, we use a script to time how long it takes to copy a folder containing 25GB of Microsoft Word documents; Windows applications; and music, photo, and video files. Dividing the size of the folder by the amount of time required gives us the drive speed (in MBps), which we report.
HandBrake: Converting a video is something many people do on computers, so it’s useful to know how well our review systems can handle the task. For that, we fire up the Handbrake video encoder, load the 6.5GB open-source Tears of Steel 4K video, and convert it using the Fast 1080p30 preset. We tell you how long it takes to complete the process—usually from about 5 to 20 minutes.
Stay in the know with Laptop Mag
Get our in-depth reviews, helpful tips, great deals, and the biggest news stories delivered to your inbox.
HDXPRT 4: We supplement HandBrake with another test designed to probe a laptop’s multimedia capabilities even further. Principled Technologies’s HDXPRT 4 uses real-world applications (Adobe Photoshop Elements, Audacity, and CyberLink MediaEspresso) to determine how well a computer can edit photos and videos and convert music files. We report both the overall number and the average time it took the system to finish each individual task.
Graphics Tests
Futuremark’s industry-standard graphics benchmarking software 3DMark has only gotten better since the company was acquired by UL in 2014. The current version offers many tests for measuring video hardware performance. We run the base Fire Strike and Time Spy tests, respectively, reporting on DirectX 11 and DX12 gaming performance. We also run Night Raid, an entry-level 1920 x 1080 DX12 test for laptops with only integrated graphics.
Gaming Tests
No, we don’t expect that most people who buy a Dell XPS 13 will want to play Red Dead Redemption 2 on it for 12 hours. (Editor’s note: That is not a good idea.) But most people will want to play something at some point casually, so we want to provide at least a glimpse into how good a genuinely mainstream gaming experience may prove.
To that end, we use a popular, easy-to-run title of a slightly older vintage that doesn’t get too bogged down by graphics hardware. Our current choice is Sid Meier’s Civilization VI with the Gathering Storm expansion installed, the latest installment in the world-building strategy franchise that has enthralled gamers for nearly 30 years. We use the Medium presets for both Performance Impact and Memory Impact, turn on 4x anti-aliasing and vertical sync off. Upon completion, the benchmark gives us a frame time; we divide 1,000 by that number to attain an average frame rate, which is the number we use. (Civilization VI tends to return relatively low scores, even though it’s still highly playable, so don’t fret if any individual system doesn’t reach the coveted 30fps threshold.)
Heat Test
At some point or another, most of us put our laptops on, well, our laps—and those who don’t still need to deal with picking up the systems and moving them around. So it matters how hot they get during general use. We run a 4K or 8K YouTube video for 15 minutes, then use an infrared thermometer to measure the heat on the touchpad, between the G/H keys on the keyboard, and the center of the laptop’s underside. Finally, we do a “sweep” of the system to discover its hottest point.

Display Tests
How bright does a laptop’s screen get, and how accurately does it reproduce colors? On some level or another, these are probably things you care about even if you’re not in the graphic design business. We delve into this realm, too, with the help of a top-of-the-line Klein K10-A colorimeter. After setting the laptop to display a field of absolute white, we use Klein’s ChromaSurf software to measure the screen’s brightness in all four corners and the center, then average the results to get the number we report. If the laptop has an OLED display, where pixels generate black by turning completely off, we do an additional test in the center of the screen with a window as close to the size of the colorimeter’s aperture as we can make it; sometimes this reveals stark differences in the brightness.
We conduct our color tests with DisplayCal, using an automated calibration procedure that returns the screen’s Delta-E value (which measures the difference between a color at the source and as displayed on the screen), along with percentages representing how well it covers the older sRGB and newer DCI-P3 color gamuts.
Battery Test
How long a laptop lasts when it’s not plugged in is one of the things people care most about when choosing a laptop. You want to know it’s going to have the power to see you through your day, whether you’re working or playing (or a little bit of both). Getting a reliable, accurate measurement of the laptop’s battery life is critical—but it takes a little work to get there.
All the changes we make in preparation for testing the battery attempt to balance usability and practical concerns, while in pursuit of a “best-case scenario”—how your laptop is likely to work paired with reasonable feature tweaks and tech adjustments to ensure our test can safely run unattended. Our list of actions includes:
- Setting the screen to 150 nits of brightness (as determined using ChromaSurf), so we have an even basis for comparison regardless of laptop manufacturer and display panel technology
- Uninstalling antivirus software
- Shutting down any programs running in the background
- Deactivating Battery Saver mode, Bluetooth, and GPS/location services
- Turning off keyboard backlighting and any gaming-specific features
- Adjusting Windows power settings so the screen stays on for the full duration of the test and battery life is maximized as much as possible.
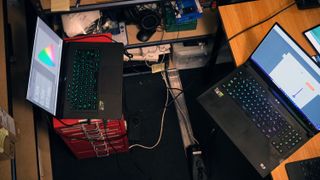
Once all that’s finished, we connect the laptop to our internal battery test network, fire up our homegrown Battery Informant software, and unplug the laptop.
The system is served up a series of pages (some static, some dynamic, some with video) from popular websites we’ve scraped and stored on a Raspberry Pi; this process continues until the laptop’s battery has run down completely.
All that’s needed to find out the exact runtime is to plug in and restart the laptop and look at a text file Battery Informant generates.
What we test on gaming laptops
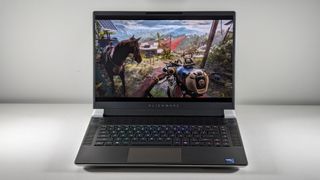
Our testing scheme for gaming laptops is similar to the one for regular laptops, except we add many more gaming-focused tests.
Additional Graphics Tests
We ramp up our 3DMark testing for gaming laptops to include Fire Strike Ultra and Time Spy Extreme, which determine how well the laptop copes with DX11 and DX12 4K graphics workloads.
If the laptop has a graphics card that supports DirectX ray-tracing, we also use the 2560 x 1440 Port Royal test. (We don’t bother with Night Raid here — who cares about integrated graphics on a gaming laptop?)
For the best-equipped laptops on the market, we may also run Speed Way, which plies the deepest and most demanding features of DX12 Ultimate.
Games
For obvious reasons, when testing gaming laptops, we forego running Civilization VI in favor of a battery of more demanding titles drawing on various genres and graphics technologies. We run all of these in full-screen mode with vertical sync disabled, always at least at 1920 x 1080 (1080p) resolution, as well as 3120 x 2100 (4K) if the laptop’s built-in display supports it.
Assassin’s Creed Valhalla: A beautiful AMD-optimized, third-person fighting and exploration game set in Norway and Anglo-Saxon England in the late 800s. We use the Ultra High Graphic Quality preset with the Adaptive Quality setting off.
Borderlands 3: It is a highly stylized third-person shooter with integrated compatibility with AMD’s graphics technology. With the Frame Rate Limit setting turned off, we use the Ultra High graphics quality preset and change the Volumetric Fog and Screen Space Reflections setting to Ultra. (This mimics the old Badass preset, which was removed in the June 2020 update.)
DiRT 5: Another installment of the fun racing gaming series, DiRT 5 runs an extensive performance test around a track in a near-perfect recreation of what you’ll see in the actual game. We max all the (non-dynamic) settings for this one.
Far Cry 6: The most recent chapter in the long-running Far Cry series, set in a fictional Caribbean nation riven by revolution, is another good FPS choice for our tests. We ran it at the Ultra quality preset.
Grand Theft Auto V: Rockstar’s 2013 action-adventure is still popular, so we still run it for its unique aesthetic and gameplay value. Aside from using DirectX 11 as the rendering engine, we tweak far too many graphics options to list here, but we put most of them on their highest or next-to-highest setting.
Metro Exodus Enhanced Edition: This post-apocalyptic FPS is designed for Nvidia’s video cards and has an easy-to-run benchmarking tool that is ideal for our purposes. We run it on the High, Ultra, and Extreme presets.
Red Dead Redemption 2: A Wild West open-world game with stunning graphics, Red Dead Redemption 2 proves a punishing test for any gaming laptop. Because it pushes current hardware to the limits, we have to adjust dozens of settings; we aim for midrange for most of them but ensure everything is activated somehow. Only extremely powerful systems can run this capably at 4K or with all the settings upped to Ultra, but we’ll rerun the test using those settings, too, if necessary.
Shadow of the Tomb Raider: What would a game lineup be without Lara Croft? She anchors this Nvidia-optimized title, which we run in DirectX 12 mode at the Highest graphics preset, with SMAA4x anti-aliasing enabled.
Gaming Heat Test
Video watching is all well and good, but YouTube will only get your gaming laptop so hot. To get a better idea of what you can expect under real-world conditions, we add a special gaming heat test: Five loops of the Metro Exodus Enhanced Edition benchmark on the system’s native resolution using the Extreme preset. We then take the system’s temperature as outlined during the sixth run.
Gaming Battery Test
Okay, okay: Even if you have the most powerful gaming laptop on the market, you’re probably not playing much on it if it’s not plugged into the wall. (Nor should you! The frame rates plummet that way.) But we want to see what happens if you try.
UL’s PCMark 10 benchmark contains a battery test that runs a 3DMark test in a window on a continuous loop until the system dies; we use this to give you an additional number to guide your purchasing decision.
What we test on professional and workstation laptops
Laptops designed for professional applications require different treatment from everyday or even gaming laptops. Even though they may be loaded with top-of-the-line processors and graphics cards, they’re not optimized (or intended) for games.
So although we still run our standard productivity regimen and battery test on them for comparative purposes, we otherwise diverge significantly.
We begin this with the help of Puget Systems. The workstation manufacturer based in Washington State has developed an excellent suite of tests for measuring how well a system handles itself with four major Adobe Creative Cloud (CC) applications. The tests in this suite include:
After Effects: One of the entertainment industry’s go-to titles for visual effects, motion graphics, animation, and other video-enhancing functions, After Effects is an ideal choice for inclusion in this suite. PugetBench uses its capabilities to process video clips and determine how well it works in Render, Preview, and Tracking tasks.
Lightroom Classic: Images captured using Canon EOS 5D Mark III, Sony a7r III, and Nikon D850 cameras are run through four active tasks (Library Module Loupe Scroll, Develop Module Loupe Scroll, Library to Develop Switch, and Develop Module Auto WB & Tone) and six passive tasks (Import, Build Smart Previews, Photo Merge Panorama, Photo Merge HDR, Export JPEG, and Convert to DNG 50x Images).
Photoshop: A series of high-resolution photographs are processed with a collection of filters and other adjustments such as resizing, mask refinement, adding gradients, and more.
Premiere Pro: A 4K video recorded at 29.97 fps and 59.94 fps is processed to apply a Lumetri Color effect and to add 12 clips across four tracks in a multicamera sequence.
We use a script to run these tests in succession (a process that usually takes several hours). Each application returns a slightly different result, and it’s the overall numbers in these areas that we report.
UL Procyon: UL, the publishers of 3DMark and PCMark, have developed two tests designed to test professional-level editing in its new-ish Procyon suite. Both the photo editing (which imports with Lightroom Classic and applies multiple edits and layer effects with Photoshop) and video editing (using Premiere Pro to export video projects to edit, adjust, add effects, and export) tests provide a nice complement to the PugetBench suite.
Although these tests are superb for helping us rate processor performance, they’re less robust when it comes to challenging workstation systems’ graphics. For this, we turn to the SPECworkstation 3.1 benchmark, which, like PugetBench, determines real-world readiness through real-world workloads. It utilizes engines from major applications, including Blender, Maya, 3ds Max, and many more.
What we test on Chromebooks
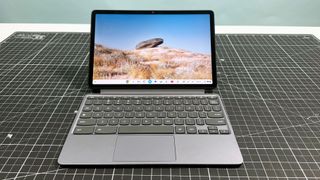
For Chromebooks, we take a slightly different testing approach. As these systems typically don’t run local software, but instead run specially designed ChromeOS apps, we treat them as what they are: a cross between a traditional PC and a smartphone.
Geekbench: We run Geekbench on Chromebooks for all the reasons previously stated.
JetStream 2: A cross-platform benchmark designed to measure performance in a wide variety of Web-based applications, JetStream 2 is an ideal test to measure a Chromebook’s prowess in these areas. Sixty-four subtests, divided among JavaScript and Web Assembly technologies, result in the single number we publish.
WebXPRT 4: This test, designed by Principled Technologies, is a synthetic collection of Web-based apps that makes as much sense for Chromebooks as it does for smartphones. Its workloads include Photo Enhancement, Organize Album using AI, Stock Option Pricing, Encrypt Notes and OCR Scan Using WASM, Sales Graphs, and Online Homework. We report the overall result.
CrXPRT 2: Principled Technologies also offers a dedicated Chromebook benchmark in CrXPRT 2, which we use as one solid method of directly comparing Chromebooks. The Performance Test we run and then repeat the score of contains six workloads: Photo effects, Offline notes, DNA Sequence analysis, Face detection JS, Stocks dashboard, and 3D shapes.
Heat Testing: This follows the same process outlined above for other laptops.
Brightness and Color Testing: These procedures are the same as those used for other types of laptops.
Battery Test: To test Chromebook battery life, we use an app we designed specifically for use with Chrome OS, which produces results not directly comparable with those we get from our standard battery test. The main difference in operation is that the test is run via a live internet connection to better simulate how you use Chromebooks in your daily life. Otherwise, this test is run the same as our standard laptop battery test, with the display forced to remain on at 150 nits of brightness and Bluetooth disabled.
Testing considerations for Apple laptops
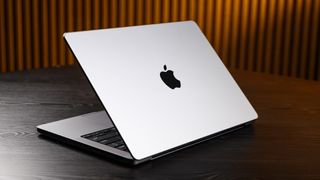
Ah, Apple — always delivering exciting new challenges. The latest products coming out of Cupertino do not always compare directly with even flagship PC laptops, but we do our best to get numbers that make sense.
Where precise macOS analogs of the appropriate software exist (such as Geekbench and Civilization VI), we use that; we sometimes need to tweak others (such as our file copy and battery tests) to come up with equivalent results.
For our Apple battery test, we measure the display in exactly the same way we do PCs, and in addition to turning off things like Bluetooth and location services, we also disable any Apple-specific settings that might interfere with a “clean” run, such as True Tone, Night Shift, and iCloud syncing. The Apple battery test is also run in, you guessed it, Safari.
Subjective evaluation
Once all the lab testing is complete, the laptop is turned over to the writer charged with reviewing it. That writer lives with the laptop for at least a few days, and sometimes longer, to see how it handles, well, life. Among the many questions the writer considers:
- What’s it like to type on? How well does the touchpad work?
- How do the speakers sound with a wide variety of content?
- Is it cumbersome to carry and set up, or is it as convenient to use as a smartphone?
- Is the design good, or is the system unpleasant to look at and use?
- What unique features does it have, and do they add to or detract from the computing experience?
- Who is the target audience for the laptop?
- Does the laptop accomplish what it was designed to?
- Is the system a good overall value for the money?
Ratings
After all of the above is completed and the review is written, the writer assigns the laptop a rating on a scale of 1 to 5 stars, with half-star ratings possible. The ratings should be interpreted as follows:
1 to 2.5 stars = Not recommended
3 to 3.5 stars = Recommended
4 to 5 stars = Highly recommended
In addition, Laptop’s Editor’s Choice award recognizes products that are the very best in their categories at the time they are reviewed. Only those products that have received a rating of 4 stars and above are eligible. Laptop Mag's editors carefully consider each product's individual merits and its value relative to the competitive landscape before deciding whether to bestow this award.
Laptop categories
Each score is recorded and compared with the average scores of all laptops in the same category. Those categories currently include:
- Chromebooks
- Budget Laptops (under $400)
- Mainstream Laptops ($400 to $800)
- Premium Laptops (Over $800)
- Workstations
- Entry-Level Gaming (gaming systems under $999)
- Mainstream Gaming (gaming systems under $1,999)
- Premium Gaming (gaming systems costing $2,000 and up)
Price ranges for the categories may change to meet current market conditions. Laptops will be categorized based on the regular price of the configuration tested.
Ratings
A notebook's results on each test are compared with results from other systems in its category. The category average for any given test and category (such as battery life for gaming laptops) is calculated by taking the mean score from the prior 12 months of test results.
Looking toward the future
We’re always busy re-evaluating the benchmark tests we run and the criteria we use to judge all types of systems to ensure we’re giving you the information that best meets your needs and represents the current state of the art in the industry. From the latest boundary-pushing games to major new technological innovations, we always want to be there, and make sure you have the information you need to come along for the ride.
To that end, please let us know what you want to see — what capabilities you want measured, what tests you want run, and what you want to do with your laptop. We’ll do everything we can to help you get there.

Matthew Murray is the head of testing for Future, coordinating and conducting product testing at Laptop and other Future publications. He has previously covered technology and performance arts for multiple publications, edited numerous books, and worked as a theatre critic for more than 16 years.
Most Popular


